
From CNBC (US) to La Nación (Argentina), data visualisation is used to explain complex stories by showing the numbers in an intelligible way. At newsrewired, Tableau’s Jade Le Van led a step-by-step workshop helping a group of delegates get started with Tableau Public. The software is free and can be downloaded here.
For those of you who couldn’t make it to the session, Jade shared some resources you can use to learn at home, as well as communities you can turn to for inspiration or support if you get stuck.
If you are new to Tableau Public and want to ramp up quickly, here are three simple steps you can take:
- Watch Tableau Public How-to Videos (3 to 5 minutes long each);
- Take part in #MakeoverMonday: every weekend, a data set is released for the community to explore, visualise, and share. It’s a great way to practice your new skills and be inspired by how other people visualise the same data.
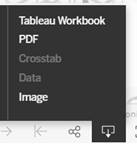
- Download visualisations you like to understand how they were made. Click on the download button at the bottom right of visualisations online. If the option Tableau Workbook is available, download it and open the file to see exactly what is in there. If you only see a dashboard, right click on the dashboard tab and choose “Unhide all sheets” to see all the elements:
The data used in the workshop was Makeover Monday’s 2017 Week 37 data on stolen bikes in the UK. Some great examples created out of this data are:
- by Athan Mavrantonis;
- by Louise Shorten.
Finally, if you’re looking for tutorials on specific chart types, you can use Andy Kirk’s Chartmaker Directory. It contains crowdsourced examples and tutorials for a wide variety of data visualisation tools including Tableau (scroll to the right to find it).