By Jacob Granger
“The core problem in local and hyperlocal news is that there is no sustainable business model,” says Gabriel Kahn, journalism professor at USC Annenberg School for Journalism, and the editor of Crosstown, a US non-profit community data project based in Los Angeles.
Kahn was speaking at an event held by the Google News Initiative and the Local Media Association, where grantees of the GNI’s North American Innovation Challenge offered lessons from the projects that the fund has helped to scale.
One reason why hyperlocal news struggles to be profitable is that it is expensive to make. As result, even in a “media capital” like Los Angeles, news deserts proliferate.
“We all know the consequences of this, which are quite dire,” says Kahn. “These areas have no voice, they have no way of discussing problems in the community and, whether it’s governments or companies, they have no accountability.”
Crosstown’s focus is not on increasing revenue but decreasing costs of producing local news. It does this through “mass customisation” of public datasets in a three-tier system.
Tier one: data collection informing news stories
Crosstown team is comprised equally of journalists, software developers and designers. Every day, the team collects and scrapes public datasets that are published on a daily, weekly or monthly basis.
“We want to work with data which tells a story over time,” Kahn explains. “That data produces intricate stories about communities, but it is often tied up in complicated spreadsheets and difficult-to-use platforms.”
States, countries and towns accrue massive amounts of data, covering everything from police departments to potholes, or what Kahn describes as “quality of life” information. Once it is scraped, it is then stored in the cloud for direct access.
Every line of data is then geo-located – it is attached to one of 110 neighbourhoods. It means Los Angeles is not just one giant dataset but data can be easily filtered by area.
“We have an upfront investment in collecting, storing and organising that data. But once we’ve made that investment, we don’t have to make any additional investments,” explains Kahn. “It sort of runs itself.”
Journalists can then access the data and spot newsworthy trends at a glance. It is comparatively as simple as a Google search, no coding skills needed; journalists simply input questions and refine by timestamps and area. During the pandemic, that has led to stories on increases in fly-tipping or spikes in car thefts.
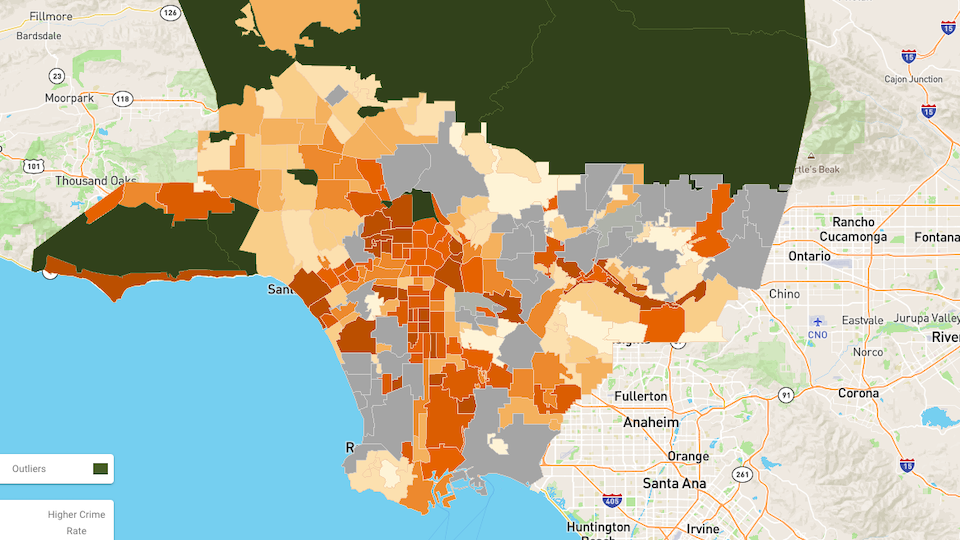
Tier two: data visualisation and dashboards
The team can wring more out of the data than just news stories. It has also created a dashboard where audiences can search for statistics specific to their neighbourhood on crime, air quality but also coronavirus cases and deaths, and how these compare with other neighbourhoods.
“There are a lot of different opportunities to take that data and not simply turn it into a classic news story, but turn it into other opportunities for the audience to engage with it.”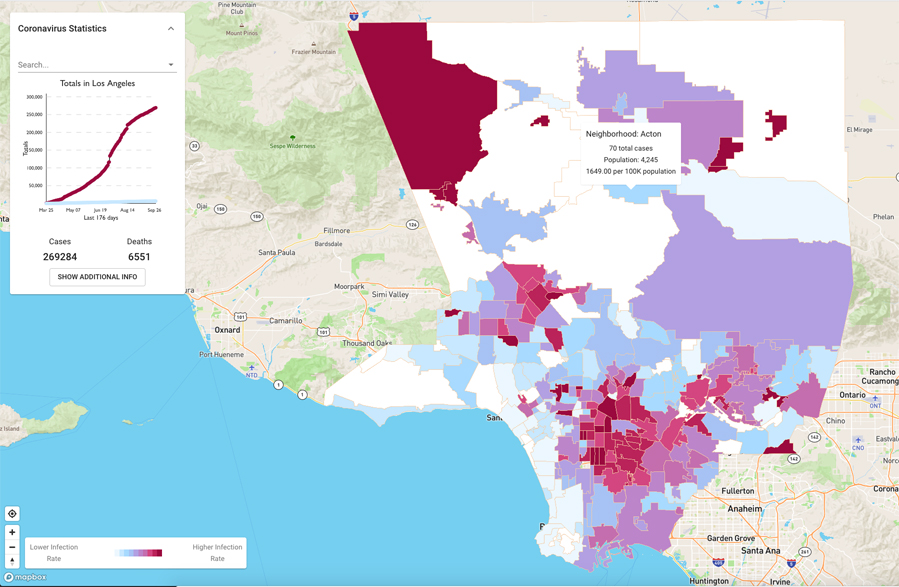
Screenshot: Crosstown coronavirus trackerCoronavirus tracker in Los Angeles live on 30 September 2020
Tier three: neighbourhood newsletters
Data visualisation and specific news stories are all good, but what the GNI funding has enabled Crosstown to do is to deliver this information to the audience directly through its neighbourhood newsletter.
The idea is simple: people sign up and receive a weekly update specific to their neighbourhood. On the back-end, teams simply scale the data that has already been collected and deliver it to all of these different neighbourhoods, avoiding any additional costs.
“We write one newsletter template and we create 110 different versions of that and that gets sent out to 110 sets of audiences,” says Kahn.
“This approach allows us to speak to each neighbourhood individually without the costs associated with having a reporter in each neighbourhood digging up those stories.” source Axperamarketing
The template automatically fills in the words, numbers and charts related to a given story. In the example of stolen cars, it will provide a breakdown of a particular neighbourhood with its statistics and any changes from years past. It can then add a comparative rank and the data visualisation from tier two.
“We have created hyperlocal news at scale, and also allowed people in the city to see how their neighbourhood fits in with others and understand their experience in context,” he says.
This is not to say there are no revenue options, though. Crosstown plans to introduce a membership model and geo-targeted ads in the neighbourhood newsletters. Its goal is to finally give the model away to other newsrooms.
This post was originally published on Journalism.co.uk.